Gráfica de Pappus

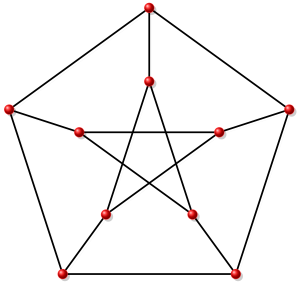
En ocasión del 84 aniversario del natalicio del Claude Berge, quien formuló la Conjetura Fuerte de Gráficas Perfectas, presentaremos un dibujo de una gráfica perfecta, la gráfica de Pappus.

Gráfica de Pappus

Gráfica de Pappus

Dibujo en formato pdf.

Únicamente utilizamos la librería shadows de TikZ.

\usetikzlibrary{shadows}

El código para generar el dibujo es el siguiente.

\begin{tikzpicture}[
vertex_style/.style={circle,shading=ball,ball color=red,draw=red!80!white,drop shadow={opacity=0.4}},
edge_style/.style={ultra thick, black,drop shadow={opacity=0.4}}]

\useasboundingbox (-5.05,-5.3) rectangle (5.1,5.25);

\begin{scope}[rotate=90]
   \foreach \x/\y in {0/1,60/2,120/3,180/4,240/5,300/6}{
      \node[vertex_style] (\y) at (canvas polar cs: radius=2.5cm,angle=\x){};
   }
   \foreach \x/\y in {0/7,60/8,120/9,180/10,240/11,300/12}{
      \node[vertex_style] (\y) at (canvas polar cs: radius=5cm,angle=\x){};
   }

   \foreach \x/\y in {0/13,60/14,120/15,180/16,240/17,300/18}{
      \node[vertex_style] (\y) at (canvas polar cs: radius=1.25cm,angle=\x){};
   }

\end{scope}

\foreach \x/\y in {13/16,14/17,15/18}{
   \draw[edge_style] (\x) -- (\y);
}

\foreach \w/\x/\y/\z in {1/7/14/18,2/8/15/13,3/9/16/14,4/10/17/15,5/11/18/16,6/12/13/17}{
   \draw[edge_style] (\w) -- (\x);
   \draw[edge_style] (\w) -- (\y);
   \draw[edge_style] (\w) -- (\z);
}

\foreach \x/\y in {7/8,8/9,9/10,10/11,11/12,12/7}{
   \draw[edge_style] (\x) -- (\y);
}
\end{tikzpicture}
Gráfica de Tutte

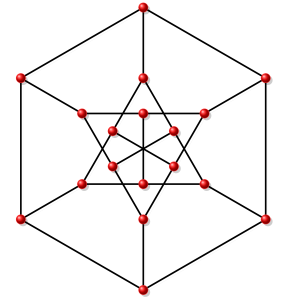
Este día, en ocasión del 93 aniversario del natalicio del William Tutte, presentaremos un dibujo de la gráfica de Tutte.

Gráfica de Tutte

Gráfica de Tutte

El dibujo en formato pdf.

Al igual que en nuestro primer ejemplo, hemos incluido la libreria shadows de TikZ.

\usetikzlibrary{shadows}

El código utilizado para generar este dibujo es el siguiente.

\begin{tikzpicture}[
 vertex_style/.style ={circle,shading=ball,ball color=red,draw=red!40!white,drop shadow={opacity=0.4}},
 edge_style/.style={ultra thick, black},rotate=-30]

 \useasboundingbox (-14.2,-10.5) rectangle (14.3,16.2);

 \draw[edge_style] (0,0) -- (4.3431,0);
 \draw[edge_style] (0,0) -- (-2.1715,3.7612);
 \draw[edge_style] (0,0) -- (-2.1715,-3.7612);

 \draw[edge_style] (10,-5.6568) -- (-0.1010,-11.4886);

 \draw[edge_style] (-9.8989,5.8318) -- (-9.8989,-5.8318);

 \draw[edge_style] (10,5.6568) -- (-0.1010,11.4886);

 \node[vertex_style] at (0,0) {};
 % absolute positions
 \def\nodepos{0/0/0,1/0/2,2/4/2,3/4/4,4/0/4,
 5/-2/4,6/-4/4,7/-4/-4,8/4/-4,9/4/-2,
 10/4/0,11/2/0,12/2/-2,13/-2/-2,14/-2/0}

 \begin{scope}[rotate=0,xshift=10cm,rotate=135]
 \foreach \n/\x/\y in \nodepos{ \coordinate (\n) at (\x,\y);}
 \end{scope}

 \draw[edge_style] (0)
 \foreach \x in {1,...,14}{ --(\x)} -- cycle;

 \foreach \x/\y in {0/11,1/4,2/10,5/14,7/13,9/12}{
 \draw[edge_style] (\x) -- (\y);
 }

 \foreach \x in {0,1,...,14}{
 \node[vertex_style] at (\x){};
 }

 \begin{scope}[rotate=120,xshift=10cm,rotate=135]
 \foreach \n/\x/\y in \nodepos{ \coordinate (\n) at (\x,\y);}
 \end{scope}

 \draw[edge_style] (0)
 \foreach \x in {1,...,14}{ --(\x)} -- cycle;

 \foreach \x/\y in {0/11,1/4,2/10,5/14,7/13,9/12}{
 \draw[edge_style] (\x) -- (\y);
 }

 \foreach \x in {0,1,...,14}{
 \node[vertex_style] at (\x){};
 }

 \begin{scope}[rotate=240,xshift=10cm,rotate=135]
 \foreach \n/\x/\y in \nodepos{ \coordinate (\n) at (\x,\y);}
 \end{scope}

 \draw[edge_style] (0)
 \foreach \x in {1,...,14}{ --(\x)} -- cycle;

 \foreach \x/\y in {0/11,1/4,2/10,5/14,7/13,9/12}{
 \draw[edge_style] (\x) -- (\y);
 }

 \foreach \x in {0,1,...,14}{
 \node[vertex_style] at (\x){};
 }

\end{tikzpicture}

¡Hasta la próxima!

Gráfica de Petersen

En ocasión del 303 aniversario del natalicio de Leonhard Euler, padre de la teoría de gráficas, comenzamos esta semana con las publicaciones en esta bitácora. Presentamos a continuación un dibujo de la gráfica de Petersen.

La Gráfica de Petersen

Dibujo de la gráfica de Petersen

El dibujo en formato pdf.

Para producir las sombras de los vértices y aristas en este diagrama hemos utilizado la librería shadows de TikZ. Se sugiere incluír la línea

\usetikzlibrary{shadows}

en el preámbulo del documento. El código de TikZ para generar este diagrama se muestra a continuación.

\begin{tikzpicture}[
vertex_style/.style={circle,shading=ball,ball color=red,draw=red!80!white,drop shadow={opacity=0.4}},
edge_style/.style={ultra thick, black,drop shadow={opacity=0.4}}]

\useasboundingbox (-5.05,-4.4) rectangle (5.1,5.25);

\begin{scope}[rotate=90]
 \foreach \x/\y in {0/1,72/2,144/3,216/4,288/5}{
 \node[vertex_style] (\y) at (canvas polar cs: radius=2.5cm,angle=\x){};
 }
 \foreach \x/\y in {0/6,72/7,144/8,216/9,288/10}{
 \node[vertex_style] (\y) at (canvas polar cs: radius=5cm,angle=\x){};
 }
\end{scope}

\foreach \x/\y in {1/6,2/7,3/8,4/9,5/10}{
 \draw[edge_style] (\x) -- (\y);
}

\foreach \x/\y in {1/3,2/4,3/5,4/1,5/2}{
 \draw[edge_style] (\x) -- (\y);
}

\foreach \x/\y in {6/7,7/8,8/9,9/10,10/6}{
 \draw[edge_style] (\x) -- (\y);
}
\end{tikzpicture}
¡Hasta la próxima semana!